| Home | Example: FX transactions (US-$/€) |
Example: Weather and radiation |
Example: The 2016 US election and Instagram | Miscellaneous | About Us |
Example: Weather and radiationWaveletComp's data set weather.radiation.Mannheim contains ten years (from January 2005 through December 2014; 3652 values) of daily average temperature, humidity, and radiation readings from Mannheim-Rheinau (Germany). Radiation data were retrieved from ODL-INFO of the German Federal Office for Radiation Protection, weather data from the historical download section of the German Meteorological Office. Radiation is the ambient gamma dose rate, an equivalent dose representing the stochastic health effects of low levels of ionizing radiation on the human body. Radioactivity is to be found everywhere in the environment. It may be of natural or artificial origin. We drew Mannheim randomly from a set of places for which weather and radiation data were available; there is no conspicuous radiation in Mannheim. Here is a plot of the three series:
 It can be seen with the naked eye that the three series are periodic, periodicity being strongest in the case of temperature and weakest in the case of radiation. For a systematic analysis, we compute the wavelet transform and plot the wavelet power spectrum of each series. The result is displayed here:
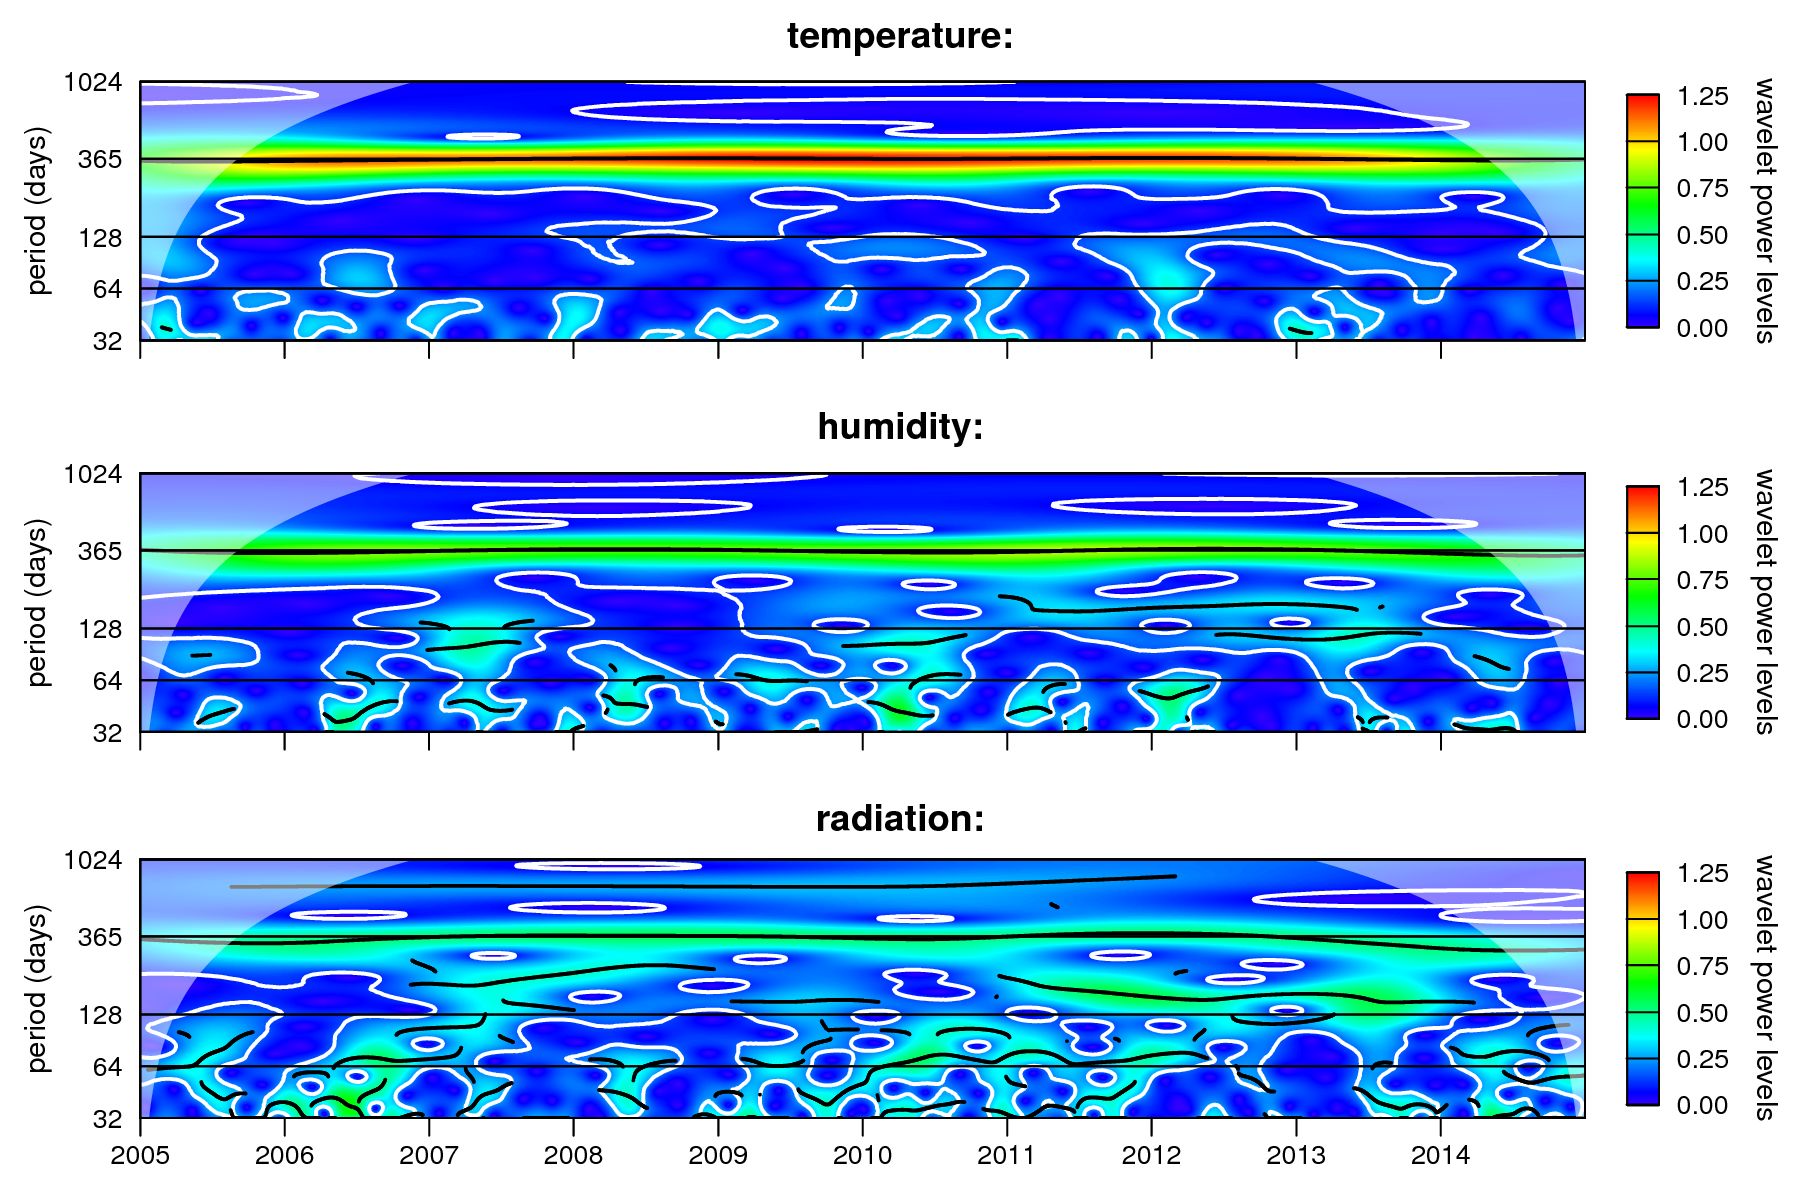 The same settings for the power level range have been used for the three plots, this makes it easier to compare the features of the three series. Indeed, there is a strong 365-day period in the temperature series. To a lesser extent, this is also true for the other two series. Radiation is a more complex phenomenon: many other periods are significant too. — There are three observations for each day, and we can use cross-wavelet analysis to investigate the periodic linkages between pairs of the three series. To that end, we need a scheme which helps interpret cross-wavelet power spectra. The following plot shows the general scheme of leading and lagging time series. The series x and y have the same period. In the upper right quarter of the plot, x is leading because it attains its maximum before y. This is represented by an arrow pointing “north-east”. The other three cases are analogous.  Here is the result of cross-wavelet transforming the three pairs. The wavelet power range is again the same for all three plots. The arrows tell us which series is leading or lagging at a given time and period.
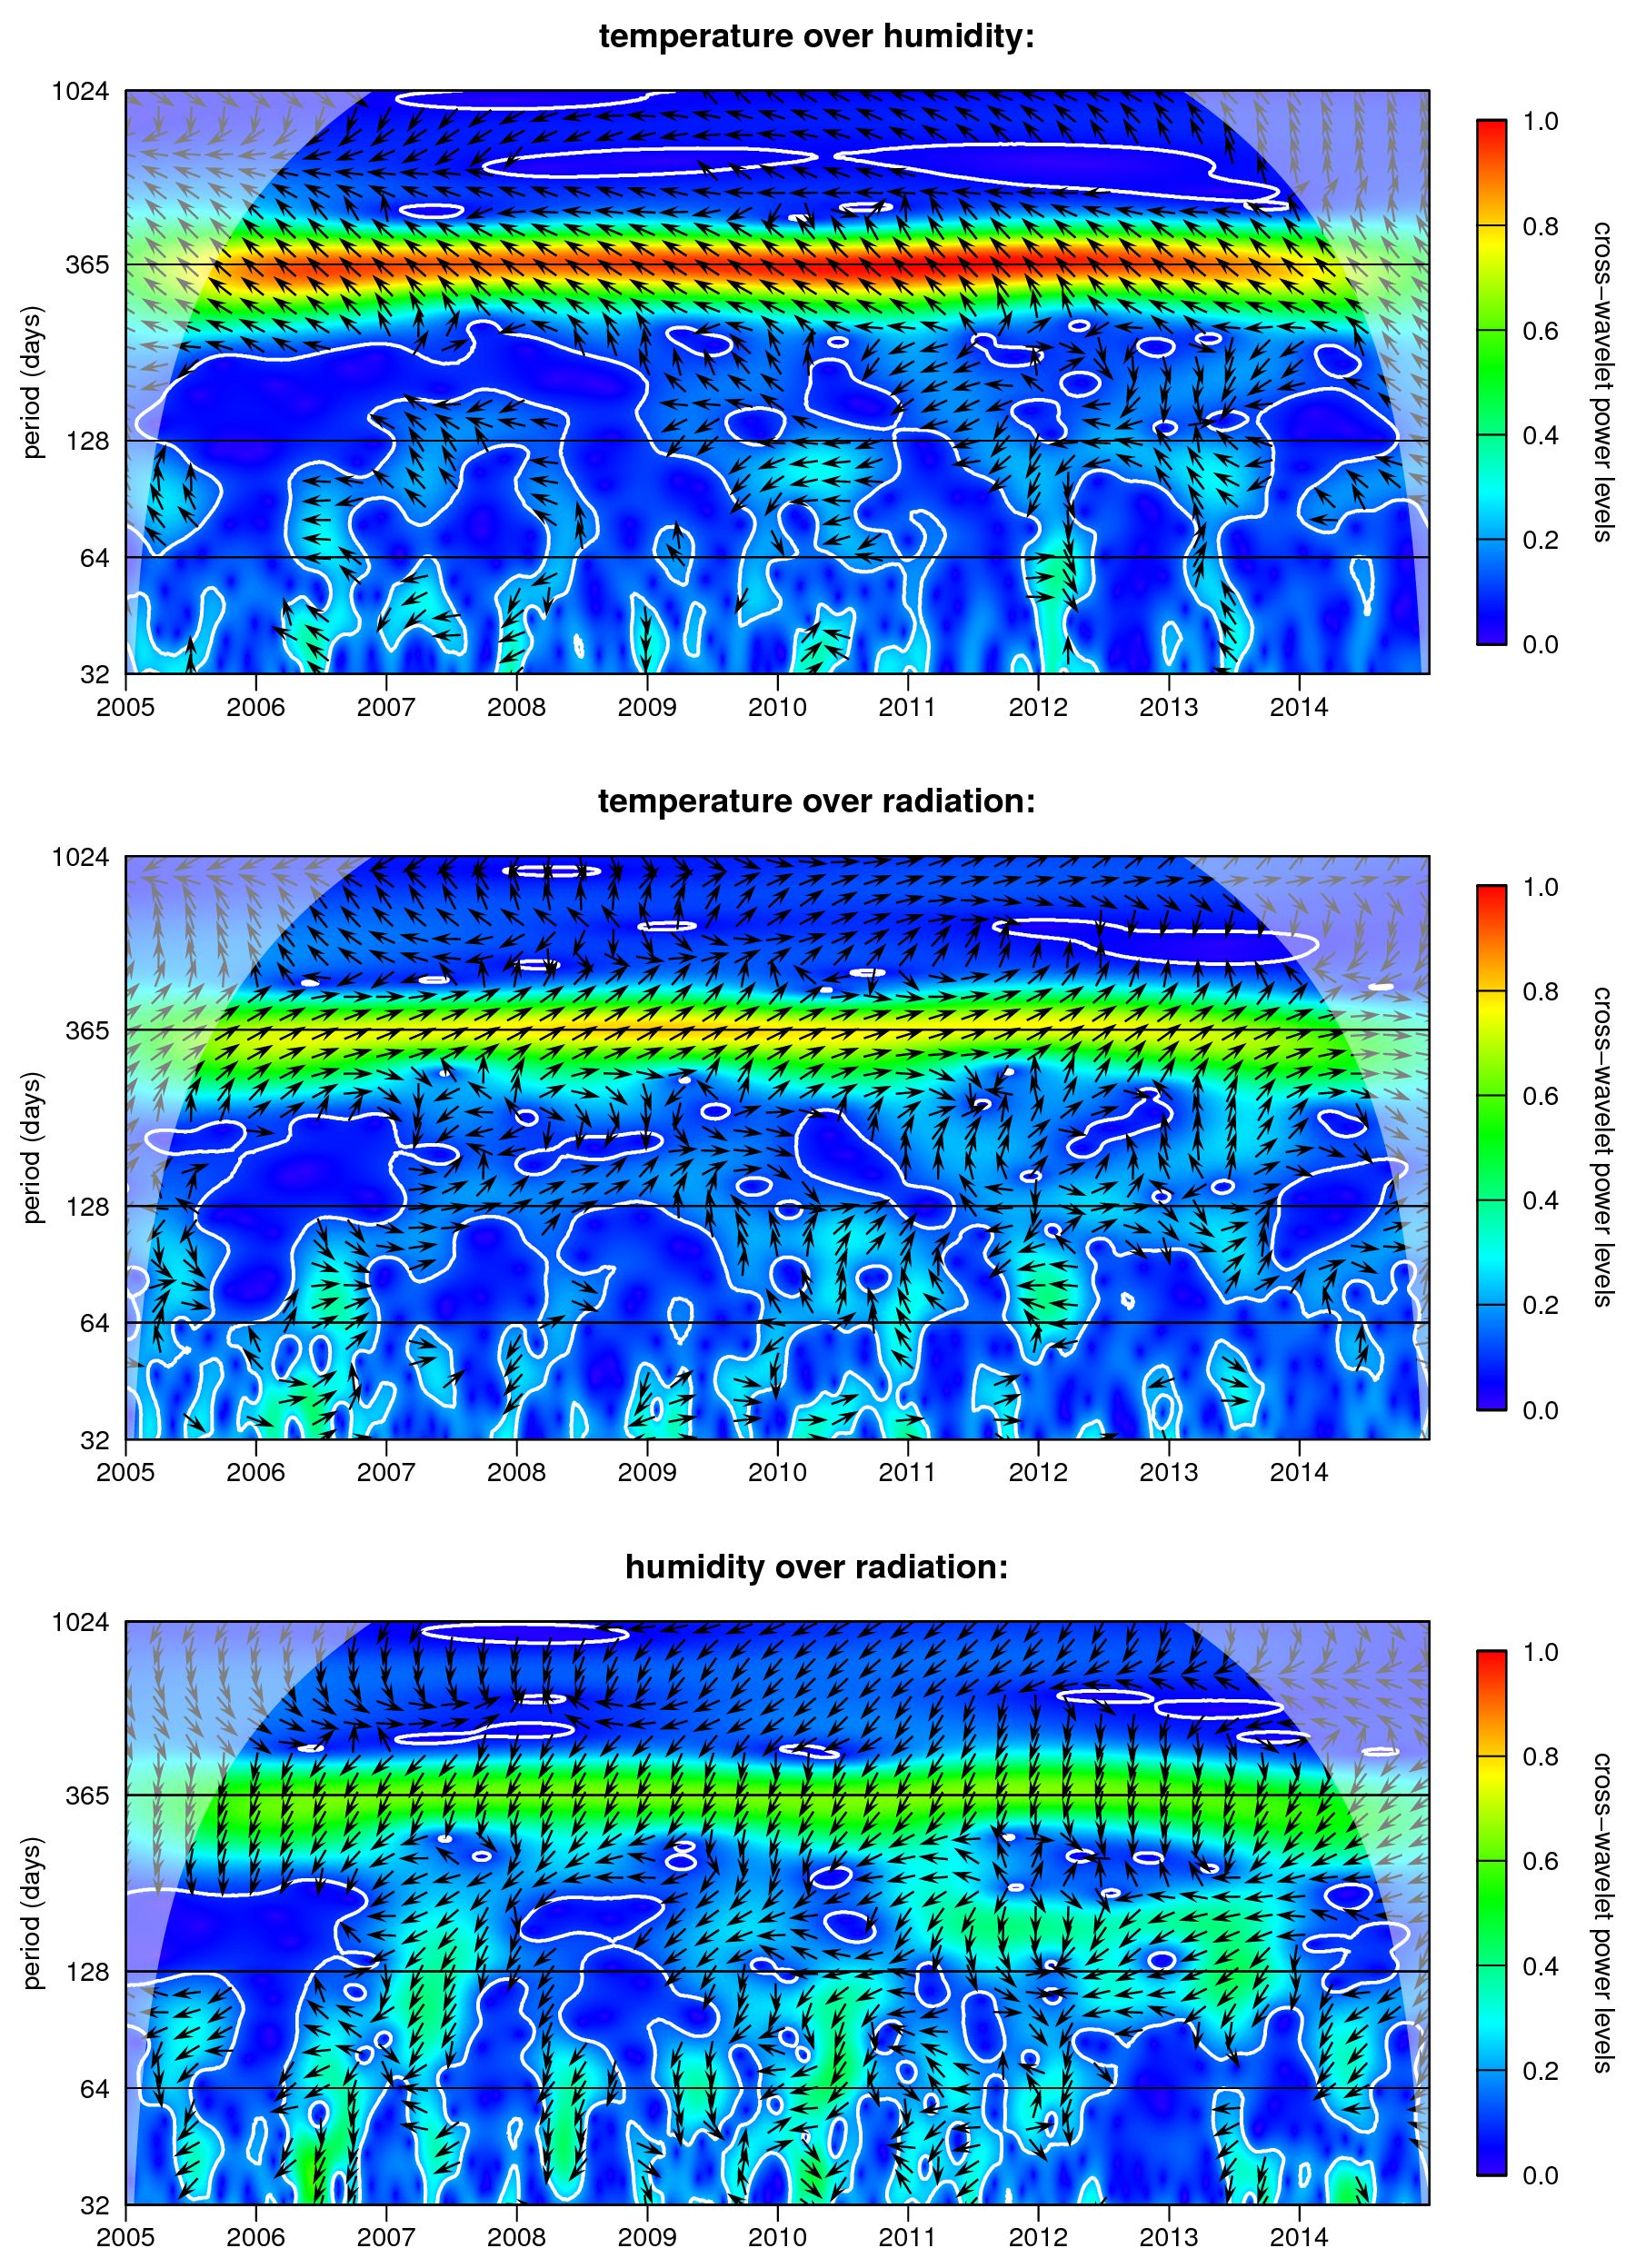 Some conclusions concerning the 365-day period are:
More about this example in Section 6 of the WaveletComp guide booklet! |
Verbatim copying and distribution of the material in the entire website of the project WaveletComp are permitted worldwide, without royalty, in any medium, provided this notice, and the copyright notice, are preserved.